
I stumbled across Google Trends on the net last year after reading a blog by Jeremy Kritt. I did a project on Trends back in June, and found it a great resource for lessons.
Google Trends provides information of what people are searching for on the internet. It allows you to explore pretty much any search item, from David Beckham to i-phones, Bognor Regis to Chelsea FC. At the click of a button, you can get information on how popular these search items are on Google, and how that’s changed over the last few days, months or years.
Here’s a search I did a while back for ‘Of Mice and Men’, analysing the popularity of this term in search engines over the previous 90 days. Here’s what I found…
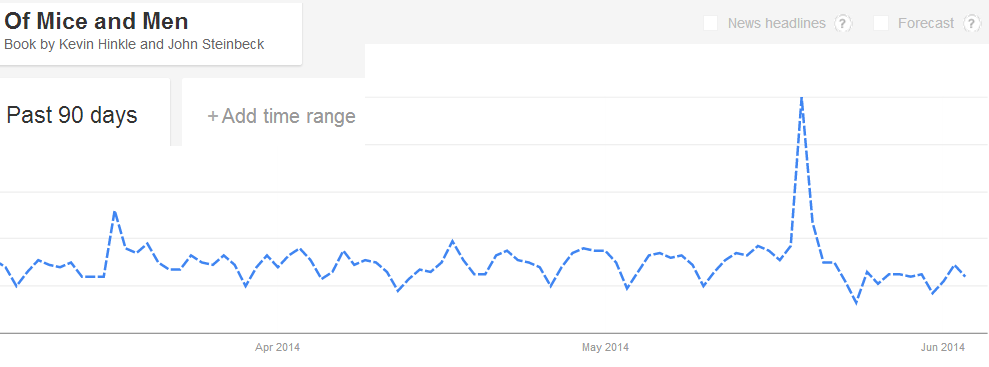
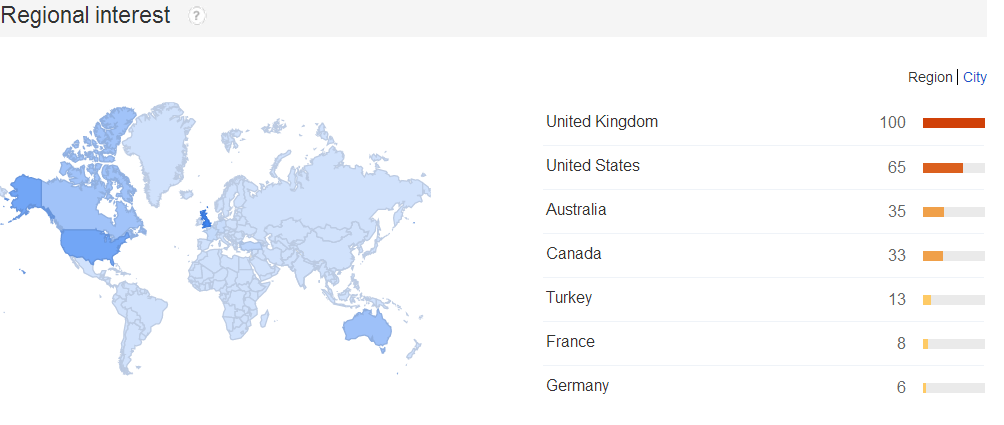
It appeared that interest peaked right around exam time! I guess UK students were taking a crash-course in the book before their GCSE exams. How did I know it was UK students? I just needed to check the regional interest statistics, provided on the same page.
You can compare up to four search terms too. Here’s a comparison of two search terms – David Beckham vs Victoria Beckham:
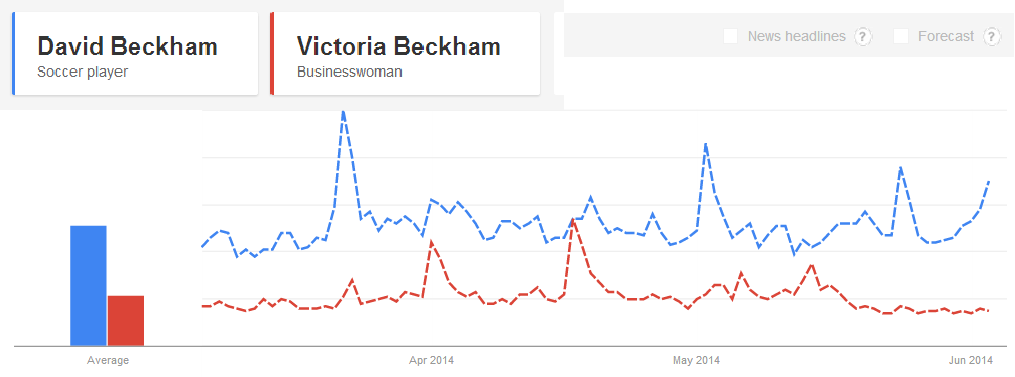
So David Beckham was a more popular search term than Victoria this time last year… Did you know that, after the UK, Singapore show the highest regional interest in David Beckham…? I wouldn’t have guessed that.
Application in the classroom
This is a really simple resource to use, and there’s so many ways it could be used in the classroom. Although I haven’t taught IELTS myself, I’ve seen lessons on interpreting data and graphs – I’d imagine this could be used for follow up tasks. For younger learners, it a great way to get students thinking critically about the world around them, and understanding things like how our own patterns of behaviour and interests can be mapped in 2-D!
Imagine starting a lesson like this:
Who do you think is more popular in the UK right now? One Direction or Adele? Wayne Rooney or Robin Van Persie?
Imagine research tasks such as this…
Between 2005 and 2011, when did global interest in Nelson Mandela peak? Use Google Trends to find the answer.
Conduct Google searches to find out why
Or even follow-up tasks to text book reading activities. Imagine the students have just read a text on Butlins (a VERY famous holiday camp from my home town)…
Is interest in Butlins declining? Is there an interest in Butlins from countries other than those in the UK? Why?
Of course, Trends is limited. It only gives you patterns on internet searches, not real statistics. It’s gimmicky. But in some ways this is an advantage as the teacher can devise questions that encourage critical thinking – how reliable is the data? Does a Google search necessarily mean people are interested in the topic? Etc…
I made a few lessons using this last year. I’ve attached one to give an idea of what could be done with this resource, but naturally these internet lessons can date quite quickly!
Google Trends lesson resources
You can access Google Trends via http://www.google.co.uk/trends/
Categories: Lesson Ideas, other

Leave a comment